Understanding the Central Limit Theorem Through Fun Visuals!
Hey there, fellow Nudgeville residents! 🌟 Today, let’s dive into a fascinating topic that often gets a mixed reception in school: statistics! Some people find it intriguing, while others might feel like it’s a confusing puzzle. One key concept that often raises eyebrows is the Central Limit Theorem (CLT). But don’t worry, I’m here to break it down for you in a fun way!
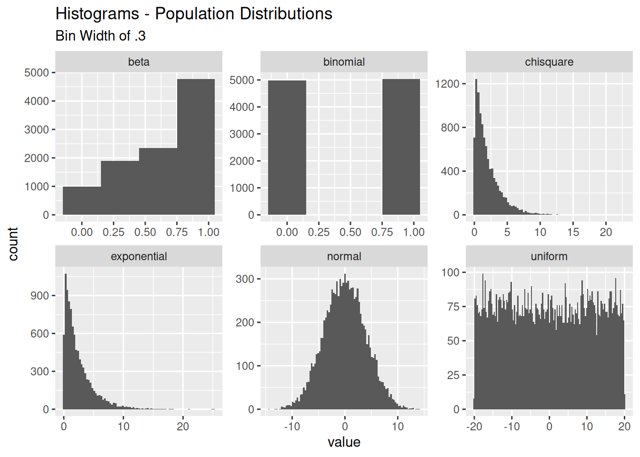
The Central Limit Theorem is like a magical bridge in the world of statistics. It tells us that if we take enough samples (at least 30) and calculate their means, those means will form a normal distribution, no matter how the original data was distributed. Imagine that! Even if you start with a wacky distribution, like something that looks like a roller coaster, once you gather enough samples, those means will start to resemble a nice, smooth bell curve. How cool is that?
To help make this concept even clearer, there are some amazing visualizations out there. For instance, a brilliant creator named Greg Foletta has put together some code samples and visuals to help folks understand the CLT better. It’s like turning complicated math into eye candy! And if you’re more of a visual learner, you might want to check out the delightful animations from 3Blue1Brown, which really bring the magic of statistics to life.
Now, you might be thinking, “Why should I care about statistics?” Well, let me tell you, statistics pop up in our lives more often than you might think! Whether it's analyzing data for a school project, understanding polls, or even just making informed decisions in everyday life, having a grasp on statistics can be super useful. Plus, knowing about the CLT can deepen your understanding of probability and help you make sense of uncertainty!
So, next time you hear about the Central Limit Theorem, remember that it’s not just a bunch of numbers—it’s a powerful tool that can help you navigate the world around you. Embrace the statistics, and who knows, you might just find yourself enjoying it more than you expected! Keep nudging forward, everyone! 🎉





💬 Comments
Log in to join the conversation.
No comments yet.